The benefits of a real-time dashboard for better insight and faster decisions

In this article
In a world where everything is happening faster and faster, organizations can no longer afford to lag behind. Organizations today generate enormous amounts of data and/or obtain it from different sources.
With a real-time dashboard you see what is happening now, not what happened last week. You immediately see where bottlenecks arise, whether there are market trends, where opportunities lie or where processes are in danger of getting stuck.
Traditional reporting falls short
Many organizations still rely on monthly or weekly reports. These are often slow, incomplete and only provide a snapshot. By the time the figures are in, the situation has already changed.
Moreover, they often lack the details that are so important for your daily business operations. A real-time dashboard enables you to adjust more quickly based on operational data, make decisions and even prevent problems before they really arise. That is what makes the difference between lagging behind and getting ahead.

The TOP 5 benefits of real-time dashboard and real-time data
Top 1. No more hassle with requesting reports or waiting for the monthly closing. You can see immediately how your company is doing now.
Top 2. Because you work with real-time and reliable data, you as management can respond more quickly to the market or trends. You do not have to guess or explain figures afterwards - you take action at the moment itself.
Top 3. Graphs, KPIs (Key Performance Indicators), meters and tables visualize and analyze the financial situation. One look at the real-time dashboard and you know what is going well and which business processes require attention.
Top 4. Because data is automatically retrieved from the data sources and displayed centrally, you reduce the chance of human error. No double work, no outdated spreadsheets, incorrect analyses.
Top 5. Because everyone - from management to team leaders - looks at the same dashboard, a shared picture of the performance, figures and priorities is created. This ensures clarity, clear analysis, prevents misunderstandings and helps teams to work better together towards common goals.
Who is a financial real-time dashboard interesting for?
1. Board and management: For strategic management of company performance at a higher level. You can see at a glance how the organization is doing, adjust business processes more quickly and make substantiated choices.
2. Financial managers and controllers: For in-depth insight into financial data, monitoring KPIs and preventing surprises. You have direct control over cash flow, budgets and cost development.
3. Team leaders and department heads: For operational management at department level. Think of insight into project costs, revenues or team objectives - all up-to-date and visually displayed.
4. Entrepreneurs and managing directors: For independent entrepreneurs or owners of medium-sized companies who want an overview without being dependent on reports or advisors. One dashboard provides an immediate answer to the question: "How is my company doing?"
5. Investors or shareholders: For stakeholders who want quick insight into the performance of a company, without first having to go through piles of reports.
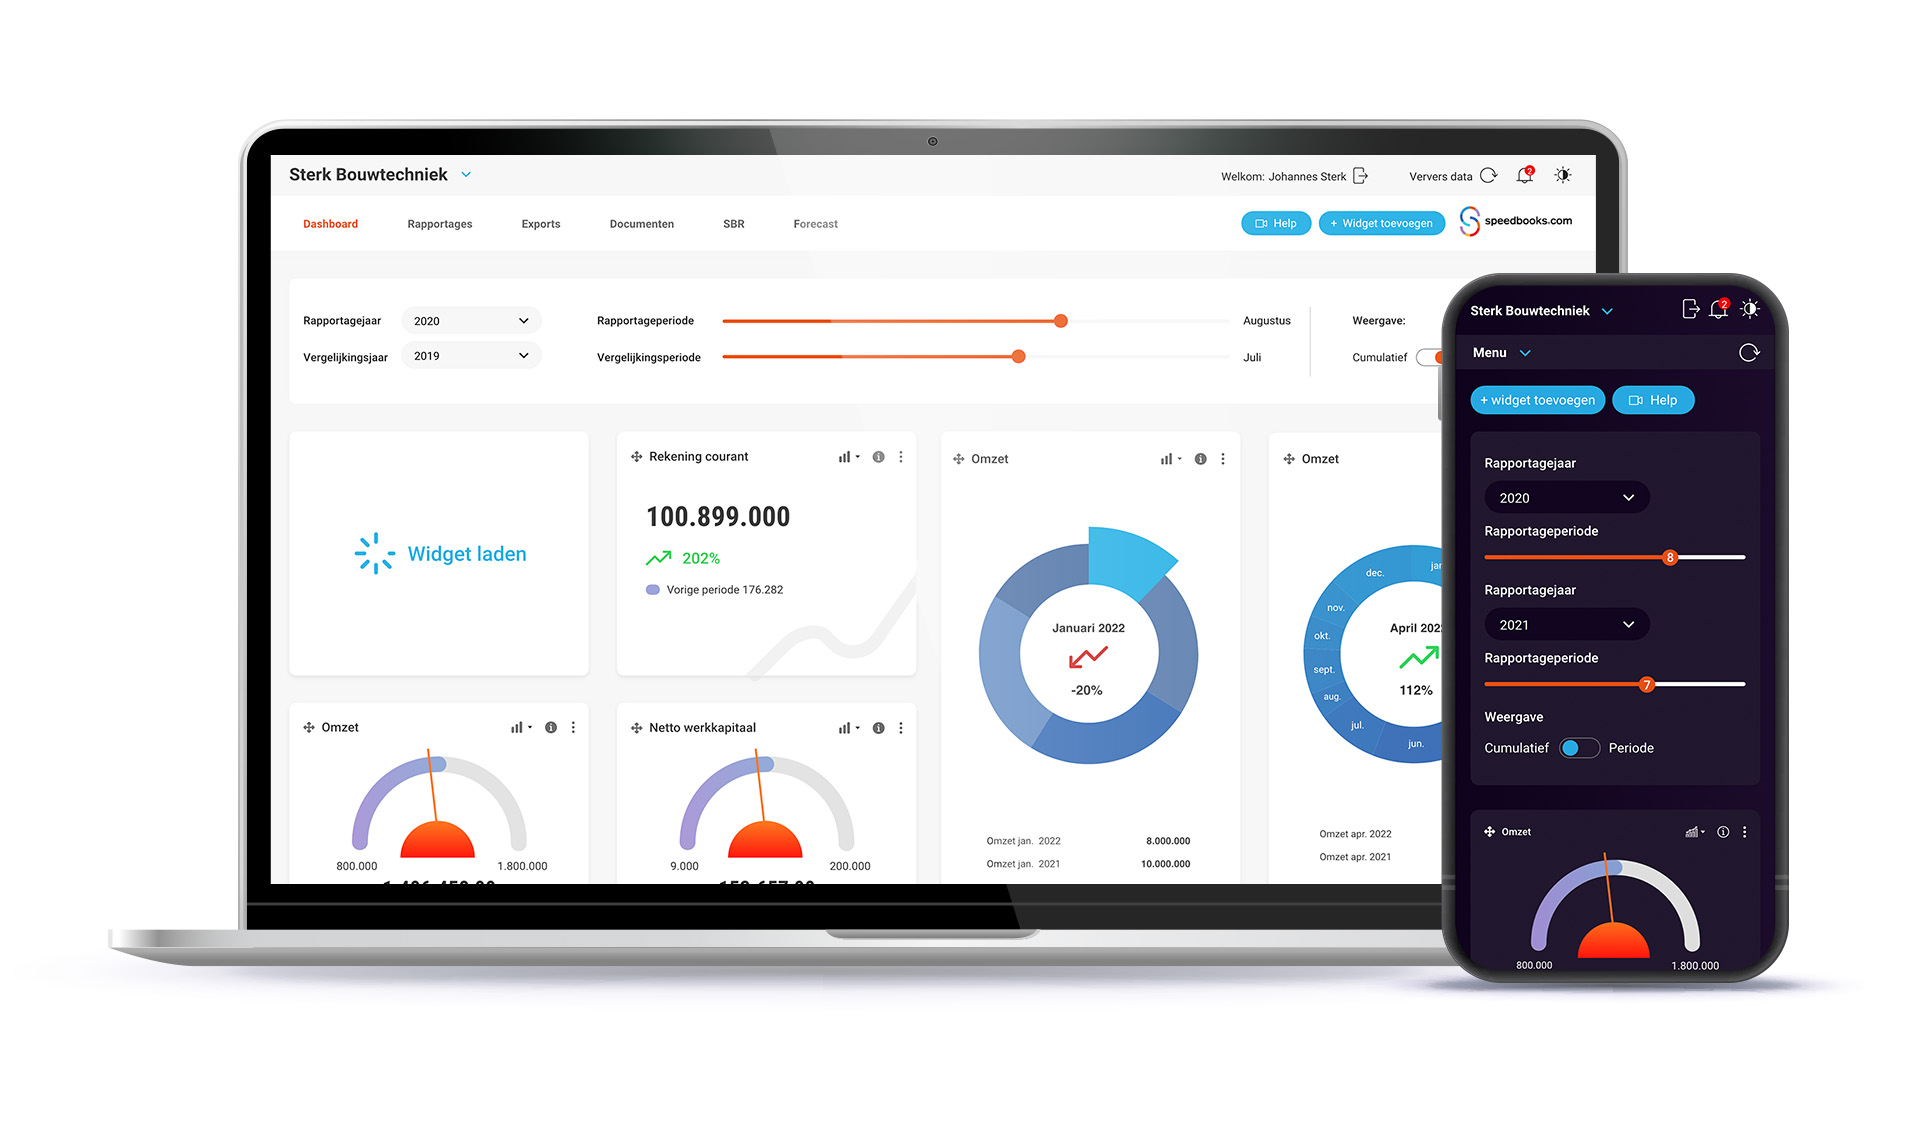
What makes a good dashboard
Real-time information is only valuable insights if it can be understood at a glance.
Must consist of clear graphs, diagrams and clear Key Performance Indicators/KPI tiles with current data. Complex tables or unclear visuals miss their target.
A good real-time dashboard is not a standard template, but tailored/adjustable to the specific needs of the user.
A dashboard stands or falls with the quality of the operational data and information. Links with accounting software, databases or other systems must be stable and secure.
Matters such as house style, use of colour and understandable terminology also contribute to recognition and ease of use.
How to work smarter together with real-time insight
You don't lose valuable time collecting data for an (interim) report.
A real-time financial, good dashboard ensures that colleagues always work with the most reliable information, the current data, so that better -joint- decisions can be made.
Everyone, from the management team to the operational departments, looks at the same data and can jointly make better decisions based on real-time information.
You can proactively adjust, for example with regard to cost control, profit optimization or adjusting the business strategy and thus prevent problems or respond to opportunities.
A joint dashboard provides more transparency, improves cooperation and makes it easier to achieve joint objectives.
How do you come by a financial dashboard with relevant information
Obtaining a financial dashboard is easy, especially if you use professional reporting software that is specially designed to provide real-time insight or current insight into your company finances.
Reporting software such as Speedbooks makes it possible to directly integrate a powerful financial dashboard into your existing system, so that you do not have to go through separate, time-consuming processes.
Why choose Speedbooks dashboard data analysis
The convenience of Speedbooks makes obtaining a reliable financial dashboard easy and accessible for everyone, accountants, controllers, from small entrepreneurs to larger organizations.
Via the Speedbooks reporting software you can quickly and easily put together a dashboard that offers you the insights you need to optimally manage a company.
You don't have to be a technical expert to get access to a powerful financial dashboard.
The software is designed to make financial management more efficient, so that you can focus on important strategic decisions, instead of on collecting data.
About the author drs. Konstantijn Mikes
Founder, inventor and shareholder of Speedbooks reporting software Konstantijn Mikes (1966) is a graduate economist. He studied Economics at the leading Erasmus University in Rotterdam.
At Speedbooks he is responsible for the content development of the reporting software, and he manages the internal developers and the external developers.